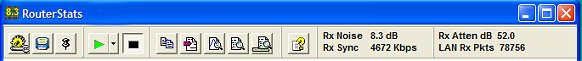
The Toolbar
RouterStats automatically saves your configuration settings when it is closed but you can save
the settings at any time by clicking the  Save configuration button.
Once RouterStats has been configured and tested, press the green Run button
 to begin
plotting the graphs and the black Stop button
to begin
plotting the graphs and the black Stop button  to stop/pause.
RouterStats will plot a point on each graph
at the interval you set on the
Graphs Common Settings Tab. The status bar indicates the time the graph was started.
to stop/pause.
RouterStats will plot a point on each graph
at the interval you set on the
Graphs Common Settings Tab. The status bar indicates the time the graph was started.
If you are using a Netgear DG834 series router, the following dialogue may appear when you press the Run button.
The default setting is for RouterStats to use the same search method to locate the stats for all routers but, by pressing 'OK',
RouterStats will use a much more accurate built-in search function which works exclusively with the Netgear DG834 series
of routers.
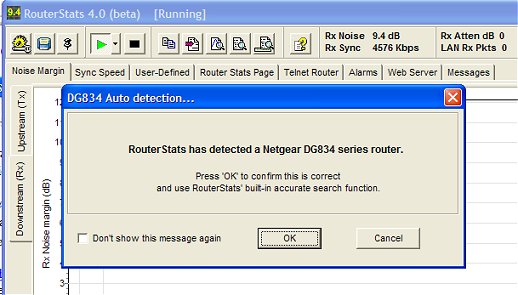
If you have already selected the built-in DG834 search function on the System Tab or on the Router Search Text
-> "Get Page" Tab, the dialogue will not appear again here.
If a Scheduled Capture time has been set, you can click the small down-arrow to the right of the Run
button and select a delayed start.
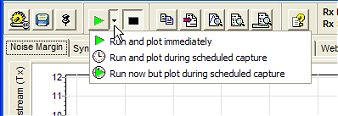 | RouterStats will then only plot points on the
graphs as shown below . Note that it's not necessary to have any actual graphs selected for
image capture (unless, of course, you want to capture the images as well). |
- Run and plot immediately is the same as pressing the main Run button.
- Run and plot during scheduled capture. RouterStats is idle outside the scheduled capture times.
- Run now but plot during scheduled capture - This enables the Noise Margin value to be read on the Toolbar and on the system tray icon
but graphs are only plotted during the scheduled capture times.
Note that RouterStats will monitor and plot points on the graphs until it
is stopped. To enable the graphs to be scrolled backwards in time, the value of each point needs to be stored in memory so each graph consumes 28 to 30 bytes of memory for each plotted point.
 Copy
Copy
To copy the visible portion of a graph to the clipboard, press the Copy button. It can then
be pasted into any application that accepts images from the clipboard (Wordpad, MS Word, Paint programs etc).
 View Log
If a text-based log has been enabled on the System & Log Tab, it may be viewed at any
time by pressing the View Log button
 Create Log
If you have not enabled the Log on the System Tab but subsequently see something 'interesting'
on one of the graphs, you can create a log from the graphs by pressing the Copy Graph To Log
button. If you choose an existing filename for the log, the new data
will be added to the end of the existing data.
 View Router Log
The View Router Log button will attempt to retrieve the router's Log.
Please note that this only works with the Netgear DG834(G) routers. A new window will open to
display the log. Right-click the window for its own popup menu (Copy, Select All and Save As)
 Graph Viewer
Graphs that have been captured with the scheduler can be viewed by pressing
the button to open the graph image viewer.
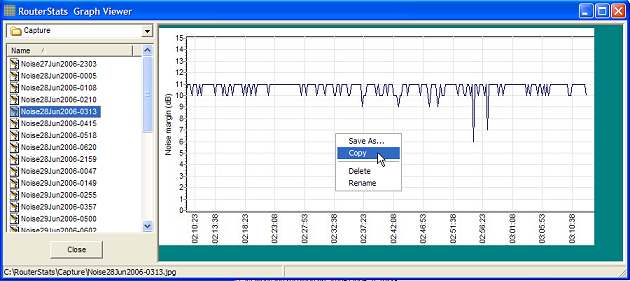
Right-click either window for the pop-up menu.