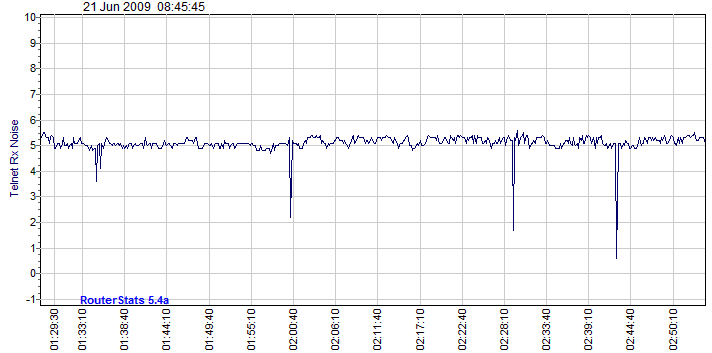
This plot clearly shows an approaching lightning storm.

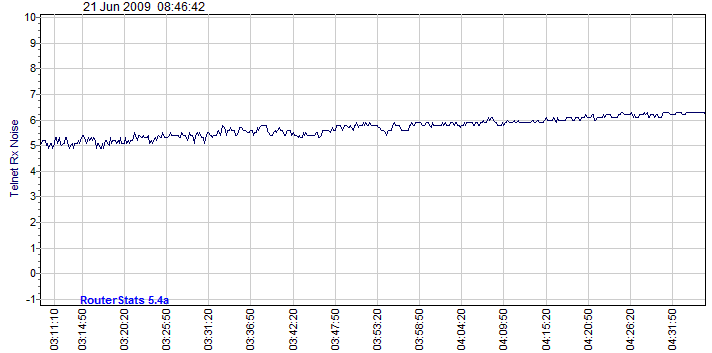
The gradual rise in Noise Margin as the sun rises. It's accompanied by a similar fall at sunset. It's often a lot more pronounced than this - especially in bad weather and the winter.

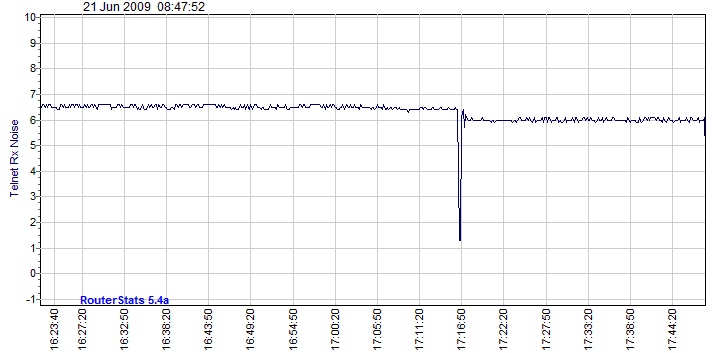
The effect of a pulse of electrical interference. As the Noise Margin is reduced after the initial pulse, it's possible that this was caused by an electrical item switching on (and staying on).
Compare with the lightning plot in which there is no step-change after the pulse.
The electrical item is not necessarily local but it is probably somewhere on the route my phone line takes back to the exchange.
Note that, in this graph, the router did not lose its connection with the exchange so the Sync Speed will not have changed. When the noise pulse does cause the router to drop its connection, the equipment in the exchange will try to establish the highest Sync Speed it can achieve consistent with the Noise Margin not going below a pre-set 'target' figure. The default being not lower than 6dB. Therefore, the Noise Margin value after a 're-sync' must be read and interpreted in conjunction with the 'new' Sync Speed.
